CAFE Standards
In 1974, the
Corporate Average Fuel Economy (CAFE) program was introduced. Beginning in the
1975 model year, automobile makers in the
1. What is CAFE?
According to the Executive Director of the National Highway Traffic Safety Administration in 2001, CAFE was “[e]nacted in 1975 in response to the energy crisis caused by the 1973-1974 oil embargo” and “requires motor vehicle manufacturers to ensure that their new-vehicle fleets meet a specified average level of fuel economy in each model year”[2]. This involves each automobile company testing “one vehicle in each base level (combination of inertia weight classes (250 to 500 pound increments), transmission class (type of transmission such as Manual 4-speed), and basic engine (engine size, number of cylinders, and type of fuel system; such as: 5.0- liter, 8 cylinder, multi-point fuel injected engine).” Each unit is tested on a set course (two courses, actually – one for ‘city’ driving and one for ‘highway’ driving) and the results are then reported to the EPA, which will re-check approximately 30% of the tests for accuracy. These results are then grouped into either passenger cars or one of the truck categories (2WD, 4WD, or combined, depending on manufacturer preference and the year under review), weighted by sales, and the harmonic average of these numbers is taken to determine compliance[3].
The average fuel economy of each corporation is compared to the requirements for the given year (see table 1 – next page) and if a company is found to be non-compliant, they are fined five dollars for each tenth of one mile the vehicle is short of meeting the standard, multiplied by the number of vehicles produced. These fines are collected by the National Highway Transport Safety Association, which can also grant exceptions and set alternative standards. Credits can also be earned and applied to past or future infractions (up to three years in either direction)[4].
Fuel Economy Standards for Passenger Cars and Light
Trucks Model Years 1978 through 2003 (in MPG) |
||||
|
Model Year |
Passenger Cars |
Light Trucks (1) |
||
|
|
|
Two-wheel Drive |
4WD |
Combined (2),
(3) |
|
1978 |
18.0 (4) |
... |
... |
... |
|
1979 |
19.0 (4) |
17.2 |
15.8 |
... |
|
1980 |
20.0 (4) |
16.0 |
14.0 |
...(5) |
|
1981 |
22.0 |
16.7(6) |
15.0 |
... (5) |
|
1982 |
24.0 |
18.0 |
16.0 |
17.5 |
|
1983 |
26.0 |
19.5 |
17.5 |
19.0 |
|
1984 |
27.0 |
20.3 |
18.5 |
20.0 |
|
1985 |
27.5(4) |
19.7(7) |
18.9(7) |
19.5(7) |
|
1986 |
26.0(8) |
20.5 |
19.5 |
20.0 |
|
1987 |
26.0(9) |
21.0 |
19.5 |
20.5 |
|
1988 |
26.0(9) |
21.0 |
19.5 |
20.5 |
|
1989 |
26.5(10) |
21.5 |
19.0 |
20.5 |
|
1990 |
27.5(4) |
20.5 |
19.0 |
20.0 |
|
1991 |
27.5(4) |
20.7 |
19.1 |
20.2 |
|
1992 |
27.5(4) |
... |
... |
20.2 |
|
1993 |
27.5(4) |
... |
... |
20.4 |
|
1994 |
27.5(4) |
... |
... |
20.5 |
|
1995 |
27.5(4) |
... |
... |
20.6 |
|
1996 |
27.5(4) |
... |
... |
20.7 |
|
1997 |
27.5(4) |
... |
... |
20.7 |
|
1998 |
27.5(4) |
... |
... |
20.7 |
|
1999 |
27.5(4) |
... |
... |
20.7 |
|
2000 |
27.5(4) |
... |
... |
20.7 |
|
2001 |
27.5(4) |
... |
... |
20.7 |
|
2002 |
27.5(4) |
... |
... |
20.7 |
|
2003 |
27.5(4) |
... |
... |
20.7 |
1 - Standards for MY 1979
light trucks were established for vehicles with a gross vehicle weight rating
(GVWR) of 6,000 pounds or less. Standards for MY 1980 and beyond are for
light trucks with a GVWR of 8,500 pounds or less.
2 - For MY 1979, light truck
manufacturers could comply separately with standards for four-wheel drive,
general utility vehicles and all other light trucks, or combine their trucks
into a single fleet and comply with the standard of 17.2 mpg.
3 - For MYs 1982-1991,
manufacturers could comply with the two-wheel and four-wheel drive standards or
could combine all light trucks and comply with the combined standard.
4 - Established by Congress in
Title V of the Motor Vehicle Information and Cost Savings Act.
5 - A manufacturer whose light
truck fleet was powered exclusively by basic engines which were not also used
in passenger cars could meet standards of 14 mpg and 14.5 mpg in MYs 1980 and
1981, respectively.
6 - Revised in June 1979 from
18.0 mpg.
7 – Revised in October 1984
from 21.6 mpg for two-wheel drive, 19.0 mpg for four-wheel drive, and 21.0 mpg
for combined.
8 – Revised in October 1985
from 27.5 mpg.
9 – Revised in October 1986
from 27.5 mpg.
10 - Revised in September 1988
from 27.5 mpg.
Table from:
“Automotive Fuel Economy Program Annual Update
Calendar Year 2001”
2. Why Fuel Economy?
On the government web site fueleconomy.gov, operated by the United States Environmental Protection Agency and the United States Department of Energy, there is a link which asks “Why is Fuel Economy Important?” According to the page pointed to by this link, under the heading “Why should YOU [sic] care about fuel economy?” there are four important items influenced by fuel economy. In order, they are “Protect the Environment,” “Conserve Resources for Future Generations,” “Reduce Oil Imports,” and “Save Money.”[5] All of these items would seem to be fairly important, and as such we will examine each one in the hopes of further explicating what CAFE is trying to accomplish.
The first item, protecting the environment, is fairly clear cut on its surface – driving cars pollutes the environment. Generally there are four chemicals or emissions discussed when describing auto pollution. These are Carbon Monoxide (CO), Hydrocarbons, Nitrogen Oxides (NOx) and Particulate Matter.[6] Carbon monoxide is produced during combustion and has an immediate effect on people exposed to it. Although it can affect healthy people in closed spaces, it is more likely to affect those with heart or respiratory diseases. According to the EPA, carbon monoxide is atypical of air pollutants in that its concentrations peak during during cooler seasons, rather than warmer.[7] Hydrocarbons and NOx work together to form ozone, which at ground level causes problems with breathing and even lung damage in humans, and can effect vegetation as well. Many hydrocarbons are also considered “toxic”, meaning the EPA has reason to believe they can cause cancer or other serious health problems.[8] Nitrogen Oxides, which are capable of traveling long distances, can also assist in the formation of particulate matter. Particulate matter, especially very fine particulate matter, can penetrate the lungs, and is associated with a wide range of health problems, including in some cases cancer. In addition to its effects on human health, particulate matter is a cause of haze, and is also capable of traveling long distances. Most mobile-source particulate matter is attributed to diesel engines.[9] CAFE addresses these issues because, presumably, more fuel efficient cars pollute less.
The
second and third items on the list, ‘conserving resources for the future’ and
‘reducing oil imports’, are also quite clear – if fuel economy increases,
ceteris paribus, fuel consumption will decrease. If fuel consumption decreases,
it would seem logical that the
The final item in our list of reasons for increased fuel economy is saving money. It would seem difficult to dispute this. If the average American drives 15,000 miles (this is the number the EPA uses to determine annual fuel costs) and an average gallon of gasoline costs $1.25 (a combination of statistics and current regional prices)[10] then at the CAFE requirement of 20.7 mpg (for trucks) one would spend $905.80 per year. On the other hand, using the passenger car requirement of 27.5 mpg, one would spend $681.82 per year, a savings of $224 per year. Using very rough estimates, then, a car which gets 27.5 mpg, kept for seven years (or 105,000 miles), would have present net benefits equal to $1361 (using a 5% discount rate) over a truck which gets 20.7 mpg. This could be a sizeable portion of the total cost of purchasing the vehicle.
Were one to solve the problems listed above, it would certainly seem to have a dramatically positive effect on the environment and the economy. So the question now becomes, does increased fuel efficiency (in the form of CAFE regulations) deal with these problems?
3. Does CAFE accomplish its own goals?
In
August of 2001, under the title “Another cup of CAFE, please.” the editors of
Scientific American magazine stated “Improving fuel economy is a worthy
national goal: it would reduce
One very quick and easy method for evaluating the question of oil use is to look at miles driven per year as compared to required fuel mileage in cars and trucks. Although this does not give us replacement rates (i.e. how many old cars are still on the road), it does give us a benchmark. Since we know mpg rates will (in most cases) be over-inflated, if oil usage remains steady, or increases, we will have fairly strong evidence that CAFE is not succeeding in that part of its goals. For the first decade, Mark Dreyfus’ work indicates that oil usage fell slightly:
Since 1978, the first year in which manufacturers were required to meet
CAFE standards, fleet fuel economy has grown 40 percent from approximately 20
mpg to over 28 mpg in 1991 (USDOT various years). Although the fuel economy
achieved by the new car fleet improved substantially, total gasoline consumption
fell only 2.5 percent by 1987 as the total number of miles traveled in the U.S.
rose from 1.1 trillion to 1.4 trillion by 1988 (USDOT 1990).[12]
However, as one can see from the following tables, observed fuel efficiency has not changed
dramatically since 1991.
CAFE PERFORMANCE CARS CAFE PERFORMANCE LIGHT TRUCKS
In order to get vehicle mile data through the year 2000, we will use the U.S. Department of Transportations numbers, which differ slightly from the numbers discussed in Dreyfus’ work but which allow us to get a more complete view of vehicle miles driven from 1960 to 2000.[13]
|
Year |
1960 |
1970 |
1975 |
1980 |
1990 |
1995 |
2000 |
|
Vehicle Miles (trillions) |
0.58 |
1.04 |
1.23 |
1.4 |
1.98 |
2.23 |
2.53 |
Using this data, and assuming the mix of domestic and foreign oil has not changed too dramatically, fuel economy standards would have had to improve by over 25% between 1990 and 2000 to account for the increased mileage driven. Note this would not decrease oil usage, merely hold it steady.
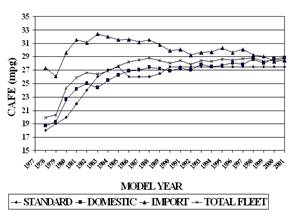
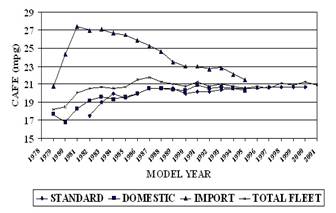 In
contrast to this, we see fuel economy performance has held steady, or in the
case of imports actually decreased since 1990. In fact the fuel economy
of imports has declined more or less steadily since the early 1980’s, [14]
though this is possibly as much due to international trade issues as to CAFE.
In
contrast to this, we see fuel economy performance has held steady, or in the
case of imports actually decreased since 1990. In fact the fuel economy
of imports has declined more or less steadily since the early 1980’s, [14]
though this is possibly as much due to international trade issues as to CAFE.
Given
the data, it seems safe to conclude that oil usage has not decreased in the
last decade. In addition, combined with the vehicle miles driven per year this
data indicates that, if people are actually getting vehicles with higher fuel
efficiency, they are choosing to drive more rather than save money. Although
there are probably more vehicles on the road than in previous years, new car
production has not increased dramatically[15].
As such, I do not think the increase in vehicle miles can be completely
attributed to an increased vehicle population. In fact, estimates indicate that
“for every 10 percent increase in fuel efficiency, people increase their
driving by two percent.”[16]
Given this increase in driving, can the CAFE regulations reach their other goal, that of pollution reduction? For evaluating pollution reduction, CAFE by itself is something of a red herring, since other acts of legislation, such as the clean air act, have had much more important effects on emissions standards. However, there are two important points about CAFE which address the question of its effectiveness in reducing pollution. The first is that pollution is always measured in units per vehicle mile. Thus, if everything else had remained constant, the increased driving brought about by CAFE would have resulted in greater, not lesser, pollution. The second piece of data relates to the fact that other pieces of legislation have made each successive generation of automobiles pollute less per mile traveled. It is argued that by raising pollution standards and the fuel economy standards the costs of new cars will rise, and more consumers will continue to drive their older, more environmentally unfriendly cars.[17]
This
second point, regarding the cost of new cars, specifically as it relates to
fuel efficiency, is often raised when discussing CAFE standards. This is a
contentious point. Although many sources cite the increased cost of cars as a
serious problem with CAFE, many other sources indicate that fuel economy
standards could be raised by a significant percentage without increasing the
cost of the vehicle. The graphs on page 7 give an indication of this
contention, since vehicles now over 20 years old were able to achieve fuel
efficiencies of over 30 miles per gallon. For example, in 1971 a Ford Torino
weighed 3302 pounds, and got 19 miles per gallon.[18] The 2003 Ford Taurus weighs 3336 pounds and
gets 20 MPG in the city, 28 Highway.[19] Considering the advances in technology of the
past 30 years, I am inclined to believe higher fuel economy could be achieved
at much lower cost than the numbers provided by the automotive companies.
Unfortunately, theirs are the only numbers available to work with.
In conclusion, upon reviewing the data for whether or not CAFE has achieved its stated goals, I believe the evidence points to an almost complete failure of the program to alleviate the perceived problems it was designed to combat.
4. An Economic Evaluation of Fuel Economy Standards
As with most
things economic, there are two sides to the question of efficiency – what are
the costs, and what are the benefits? The question of an efficient level of
fuel economy is no different. Too rigid a standard would result in placing an
excessive cost burden on manufacturers and, presumably, automobile buyers. Too
lax a standard would result in excessive gasoline usage, placing a burden upon
drivers as well as forcing the state to acquire additional oil resources,
resulting in higher research and development costs and, assuming oil is on the
list of resources with security premiums attached, adding additional security
costs. Although it is outside the scope of this paper to attempt to model whether
CAFE is efficient, it is worthwhile to consider which elements should be
included in such a model, and state the assumptions which would accompany their
inclusion.
We will begin by evaluating the costs of the government requiring a certain fuel efficiency. These costs are first and foremost the administrative costs of the program. Second is the cost to automotive companies. These costs will directly affect the third component, the costs to consumers. And finally, we will look at external costs – those effects which are not reflected in the monetary evaluation.
To begin with, there are the administrative costs to the government of any regulative program. The official numbers are that the National Highway Traffic Safety Association spends approximately $60,000 per year administering CAFE (along with some other related data gathering tasks).[20] Although they have requested this number be increased to $1,000,000 for FY 2003, it appears going back to 1999 they have had at most $60,000 in funding (excluding 1999 when no funds were appropriated!) The numbers in the budget are extremely small, and as such I make the assumption funds are also listed under other programs. If the numbers in the budget are correct, administrative costs for CAFE are not a major component of the programs total economic effect.
The
costs to automobile companies, on the other hand, are generally considered to
be a major component of the total costs of CAFE (at least according to the
companies themselves). One study found that “increasing the CAFE standards by 3
mpg would reduce annual profits at General Motors by $433 million, at Ford by
$455 million, and at Chrysler by $236 million. Total losses to
|
CAFE FINES COLLECTED DURING CALENDAR YEAR 2001 |
|||
|
Model
Year |
Manufacturer |
Amount
Fined |
Date
Paid |
|
1999 |
Volkswagen of America, Inc. |
$224,840 |
02/01 |
|
Fiat Motors of |
1,066,395 |
04/01 |
|
|
Lotus Cars USA, Inc. |
51,909 |
12/01 |
|
|
2000 |
BMW of |
26,408,646 |
06/01 |
|
BMW of |
971,696 |
06/01 |
|
|
Porsche Cars North America, Inc. |
3,720,816 |
06/01 |
|
|
Volkswagen of America, Inc. |
276,309 |
08/01 |
|
|
Fiat Motors of |
686,521 |
12/01 |
|
1BMW passenger car fleet
2BMW light truck fleet
Table
from NHTSA Automotive Fuel Economy Program Annual Update Calendar Year 2001
The
costs of CAFE to consumers is directly related to the
costs of automakers, since most costs will be passed on in the price of the
car. This can have a profound effect economically, as Andrew Kleit noted in
Regulation magazine:
With respect to consumers, losses are
measured in terms of the economic concept of "consumer surplus." For
example, assume a consumer values a car for $20,000, and is able to purchase it
for $18,000. That consumer would gain $2,000 in consumer surplus. If CAFE
standards make that car unavailable and the consumer chooses not to purchase a
car, the new standards would have caused a loss of $2,000 in consumer surplus
for that consumer. If the fuel efficiency standards were to be increased 3 mpg,
I estimate that
A related effect, one more difficult to assign a price to, is the reduction in choices the consumer may have if CAFE limits change the mix of domestically produced vehicles. If domestic producers are “’mix-shifting’ - selling fewer large cars and more small cars by raising prices on the former and lowering them on the latter”[25] the consumer will have fewer cars to choose from at certain price points.
In
addition to the costs the government, producers, and consumers will have to pay
in direct terms, there are also several external costs to be considered. Many
of these are related to the previously mentioned fact that higher fuel economy
results in more vehicle miles. Higher vehicle miles results in more pollution,
additional congestion[26], and
additional roads built to relieve congestion.[27]
Additional roads have a significant social and environmental impact, including
impact on soils, water supplies, flora and fauna, and land use.[28]
A possible external effect of CAFE which has been quite controversial is the concept of safety. As mentioned earlier, one of the routes auto makers took to improve safety was reducing the weight of the automobile. This led many to the conclusion that fatalities would rise. An example of this idea, used as evidence before the senate, stated that “the 27.5 mpg CAFE standard for passenger cars was responsible for a 500-lb. drop in the average weight of a new car, and that this translated into a 14-27 percent increase in occupant fatalities--2,200 to 3,900 additional traffic deaths per year.”[29] Using virtually any reasonable valuation on life, this would be a tremendous negative externality. However, evidence is mixed on the actual effect of reduced vehicle weights on safety. Because of the complexity required of any model which attempts to separate driver related variables from vehicle related variables, studies are thoroughly mixed on whether CAFE has actually caused additional deaths.[30] One study for example found that drivers of smaller cars were more cautious, which resulted in fewer accidents.[31] Other studies involving vehicles of differing masses colliding with fixed objects (for example, telephone poles or trees) indicated that lighter vehicles had higher fatality rates. These studies as a whole show that the definition of safety is quite malleable, and depending on how it is defined lighter vehicles can be viewed as ‘more’ or ‘less’ safe. The debate over safety as it relates to changes in vehicle weight will probably last far longer than the debate over CAFE.
An externality which is much less in dispute with regard to safety, however, is the relationship of accidents to vehicle miles. It is generally agreed that there is a relationship between the number of miles driven and the number of accidents which will occur. Generally, insurance is paid for based on the length of time and the assumed risk of the driver. As such there is no marginal cost to driving additional miles, despite the fact that there is a societal cost to additional miles being driven.[32]
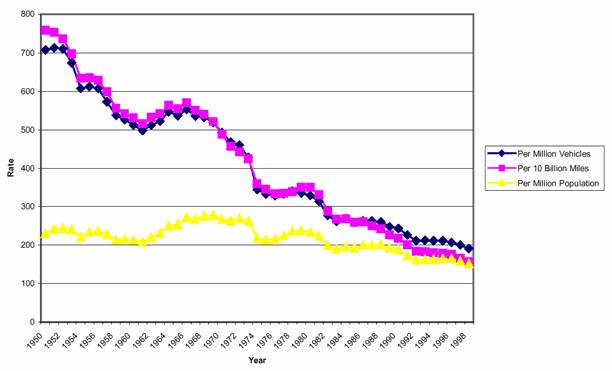
Motor Vehicle Crash Death Rates, 1950-1998.
Source:
National Safety Council, Injury Facts, 1999 Edition[33]
Other items which must be considered on the cost side include noise pollution, increased road maintenance costs[34], disposal costs[35] (if the assumption is made that cars are wearing out more quickly due to the increased miles driven) and - a subject popular near universities - parking.[36]
Overall, the external costs appear to be more numerous and also more difficult to value
than the costs to consumers, producers, or the government. A complete econometric evaluation of costs is going to be seriously contingent on the safety issue, since estimates range from zero (assuming there is no safety issue) to $9,750,000,000 (using the 3900 death high end Crandall and Graham computed and multiplying by 2.5 million dollars per death).[37]
The benefits of
legislated fuel economy, in contrast to the costs, are easier to enumerate, and
for the most part to assign a value to. For example, with higher fuel economy
vehicles, consumers spend less on gasoline per mile traveled. According to the
NHTSA, lifetime savings for vehicles manufactured under CAFE regulations (1977
for cars and 1978 for trucks) were as follows:
|
|
Reduced Fuel |
Dollar |
|
Total (All Vehicles) |
45.6 billion gallons (1.1 billion barrels) |
$53.8 billion |
|
Per Vehicle |
974 gallons |
$1,146 |
From: NHTSA and Parsons, National on road survey
We can thus put a direct number on the savings to consumers for driving any particular number of miles. The question as to whether they would drive those miles were their cars less fuel efficient is one which would be very difficult to answer, but regardless of whether the benefits are in the form of extra money or in the form of marginal social side benefits accruing from the extra miles driven, the benefits do occur. Putting a value on being able to drive extra miles might be found by monitoring miles driven versus current fuel prices for different regions.
A
more difficult number to quantify is the ‘feel-good factor’ of driving a more
fuel efficient vehicle. Since it is widely accepted that more fuel efficient
vehicles are good for the environment, many would assign a certain amount of
value to the appearance of being more ‘earth-friendly’ given by driving a more
fuel efficient vehicle. Some would even argue driving a less fuel efficient vehicle
imperils one’s soul. According to the ‘What Would Jesus Drive’ campaign,
“Making transportation choices that threaten millions of human beings violates
Jesus' basic commandments: ‘Love your neighbor as yourself’ (Mk.
5. Conclusions
CAFE was enacted
with the goal of reducing American dependence on foreign oil, controlling
pollution, and meeting the needs of consumers at the time for more fuel
efficient vehicles. Unfortunately, what was enacted served none of those
purposes efficiently. In section three we evaluated the success of CAFE in
addressing the issues for which it was designed, and it was shown that in many
instances the benefits of increased fuel economy were either less than expected
or completely nonexistent. The growth of vehicle miles in response to higher
fuel economy would seem to have increased, rather than decreased, pollution.
The effect on oil consumption is more complex, in that although the effect of
increased fuel economy on number of miles driven is clear, whether or not this was
in response exclusively to increased fuel economy is not definite. As
Tietenberg points out, “Low transport cost encourages dispersed settlement
patterns…. Once settlement patterns are dispersed it is difficult to justify
high volume transportation alternatives….”[39] I
do not believe any model will be able to tell us whether suburbanization
was driven to its present level because of increased fuel economy. My personal
belief is that consumption would have increased regardless, in which case CAFE
has reduced oil consumption, and should be moved from the ‘costs’ column to the
‘benefits’ column. Were one to make the assumption CAFE had actually driven
urban sprawl, however, then it would be responsible for increased, rather than
decreased, consumption. The remaining factor, consumer demands for more fuel
efficient vehicles, could most likely have been dealt with more effectively by
letting market forces do their work. In addition, any increase in vehicle miles
CAFE was responsible for exasperated already existent externalities. Specificity
says that one should deal with problems at their source. In this case,
legislation was enacted which attempted to deal with multiple problems and in
doing so dealt with none of them. Although we did not develop exact numbers
here for the costs and benefits of CAFE, it is quite clear that the costs were
many and the benefits fewer than expected. In addition, by choosing a
politically powerful industry to regulate, congress ensured that any
legislation which could be enacted would be too little, too late, and would
come at enormous cost to the taxpayers footing the bill for endless hearings,
committee meetings, industry consultations, and so forth. Overall CAFE has not
encouraged an efficient level of oil consumption, and does not appear destined
to in the future.
Bibliography
Committee On Effectiveness And
Impact Of Corporate Average Fuel Economy (Cafe) Standards, “Effectiveness And
Impact Of Corporate Average Fuel Economy (Cafe) Standards”.
http://www.nap.edu/html/cafe/
Dreyfus, Mark, “BROADENING THE COMPARISON OF GASOLINE
TAXES AND CAFE STANDARDS: DISCOUNTING AND VALUATIONS OF
VEHICLE SAFETY CHANGES”
Evangelical Environmental Network and Creation
Care Magazine. “What Would
http://www.whatwouldjesusdrive.org/
Grad, Frank P. et al. The Automobile: and the Regulation of
its Impact on the Environment.
Kazman, Sam. Of the Competitive Enterprise
Institute, before the house committee on commerce, subcommittee on
telecommunications, trade and consumer protection regarding reauthorization of
the national highway traffic safety administration. May, 1997.
http://www.house.gov/commerce/telecom/
hearings/052297/kazman.pdf
Kleit, Andrew N. “CAFE changes, by the numbers.” Regulation,
Marzotto, Toni, Burnor, Vicky, and Bonham, Gordon Scott. The Evolution of Public Policy: Cars and the Environment. Lynne Rienner Publishers, 2000.
National Highway Traffic Safety Administration, “Budget in
Brief”
http://www.nhtsa.dot.gov/nhtsa/whatis/bb/
National Highway Traffic Safety Administration (Glenn Parsons),
“Fuel Economy and Annual Travel for Passenger Cars and Light Trucks: National
On-Road Survey” Report Number DOT HS 806 971.
http://www.nhtsa.dot.gov/cars/rules/regrev/evaluate/806971.html
Nieuwenhuis, Paul and Wells, Peter. Motor Vehicles in the Environment. John Wiley and Sons, 1994.
Scientific American, Editors. “Another cup of CAFE, please.” Scientific American v. 265
(i.e. 285) no2 (Aug. 2001) p. 6
Tietenberg, Tom. Environmental and Natural Resource Economics. Addison Wesley Longman, Inc. 2000.
Tsunokawa and Hoban, “Roads and the
Environment – A Handbook” World Bank Technical Paper No. 376. November,
1997.
http://www.epa.gov/OMS/cert/dearmfr/fepfs.pdf
U.S. Environmental Protection Agency, “Milestones in Auto Emissions Control,” EPA publication 400-F-92-014. August 1994. Fact Sheet OMS-12.
http://www.epa.gov/otaq/12-miles.htm
http://www.epa.gov/otaq/invntory/overview/pollutants/index.htm
U.S. Department of Transportation, Bureau
of Transportation Statistics, “National Transportation Statistics 2001” Bureau
of Transportation Statistics publication BTS02-06. July 2002. http://www.bts.gov/publications/nts/
http://www.bts.gov/publications/nts/html/table_01_16.html
Yun, John M. “Offsetting Behavior Effects of the Corporate
Average Fuel Economy Standards”. Economic Inquiry, April 2002 v40 i2 p260(11)